Climate Change Adaptation

Temperature and Rainfall

The Northern Hemisphere Land Summer Temperatures shown above illustrate the actual record hot weather for the period of 1981 to 2011, in 10 year increments (see deep red areas). This is compared to a 30 year historic data base for the period of 1951 to 1980.
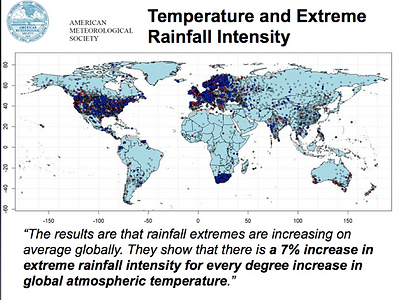
Having illustrated increased mean land surface temperature; the connection to Extreme Rainfall Intensity is shown at right. "There is a 7% increase in extreme rainfall intensity for every degree increase in global atmospheric temperature." This statistically significant positive correlation of temperature and rainfall extremes is represented by deep blue dots on the map at left, from several thousand weather stations. Statistically significant negative correlation of temperature and rainfall extremes are represented by the red dots.
Reference Link for this analysis is provided here, and is published in the American Meteorological Society.
The simplified logic of this is; warmer air can hold more water vapour than colder air. As air temperatures in general increase, due to climate change, more water vapour is available as rain when that air rises, cools and condenses.
This change in temperature and rainfall will have an effect on frequency and severity of flood.